
Your pension holds more AI than you think: what the market fall changes for you
The Nasdaq fell 5.5% in a day, and Seoul and Tokyo nearly 6%. Wall Street rebounded on Friday and is still up for the year, but if your fund or pension holds shares, this touches you more than it seems. No one knows yet whether it was a stumble or a turn.

What it means for you · Analysis
Published 7 November 2026 · Updated 7 November 2026 · See timeline
If your pension or savings are in stock funds, you already have money riding on artificial intelligence, whether you know it or not. This week that bet was shaken. It is not yet clear whether this was a stumble or the start of something bigger.
What happened
Thursday, 5 November. Wall Street had its worst day since April 2025. The S&P 500 fell 4.4% to close at 7,353.73 points; the Nasdaq lost 5.5% to close at 24,315; the Dow Jones dropped 1,833 points (3.4%). Nasdaq companies lost up to about $2.5 trillion in market value. The Philadelphia Semiconductor Index plunged 12.3%, its worst session since March 2020. The VIX, a measure of market nervousness, jumped from 16.61 to 28.18.
Friday, 6 November. The sell-off spread to Asia. South Korea's Kospi fell as much as 8.78%, which halted trading for 20 minutes, and closed down 6.02% at 5,059.69. Japan's Nikkei closed down 5.96% at 57,434.77, its third-largest point drop in history. Taiwan's Taiex lost 4.51% to close at 39,701.64. In Europe, Germany's DAX (1.92%), Britain's FTSE 100 (1.01%) and France's CAC 40 (0.81%) all declined.
That same Friday, Wall Street rebounded. The Nasdaq rose 1.1% and the S&P 500 0.3%, helped by better-than-expected jobs data. The Dow Jones slipped 0.5%. An index falling does not mean everything has fallen: most major stock markets are still up for the year.
| Index | Close 6 Nov | In 2026 | From its record |
|---|---|---|---|
| S&P 500 | 7,376.86 | +7.8% | −5.7% (6 October) |
| Nasdaq | 24,579.42 | +5.8% | −10.9% (6 October) |
| Nikkei | 57,434.77 | +14.1% | −20.6% (25 June) |
| Kospi | 5,059.69 | +20.1% | −44.5% (22 June) |
Why it fell, and what is not known. The facts point to three concerns, and none is proven as the sole cause. First, investors have doubted for months that the enormous spending on data centers will deliver what it promises, and they question how much it costs to finance. Second, some believe these stocks rose too far, in a bubble. Third, Democrats won control of both chambers of Congress on 3 November, and several governors-elect promised to pause new data centers. But the easy explanation deserves caution: on the day after the election, Wednesday the 4th, the Dow rose 3% and the S&P 500 1.6%. With the same election result, the market rose one day and plunged the next.
How it reaches you

Most people do not buy shares in artificial intelligence companies. But many hold them anyway, through a fund. In the United States, 56% of families held stocks directly or indirectly in 2025, and about 65% participated in some kind of retirement plan, according to the Federal Reserve.
| Channel | Effect | Why |
|---|---|---|
| Pensions and retirement funds | High if they hold stocks | A fall lowers the balance immediately. What determines the real effect is when you need that money: retiring in 30 years is not the same as retiring in two. That is why many plans automatically reduce their stock holdings as the retirement date approaches. |
| Index funds | High | These funds allocate money according to each company's stock market size, and today the largest are tech companies. In a large fund tracking the S&P 500, the top 10 positions added up to 37.6% as of 5 November. In the global MSCI World index, the United States accounts for 72.8% and technology for 29.8% (30 October). Holding many stocks does not mean holding them in equal shares. |
| Savings and deposits | Low | A stock market fall does not touch a bank deposit. Rates remain high: the one-month US Treasury bill yields 4.02%. But US inflation was 3.7% in September, so the real gain is small. |
| Employment | Low for now, uncertain | Employment shows no damage: the United States added 165,000 jobs in October and unemployment stood at 4.1%. The risk lies further ahead. The US economy grew at an annualized 3.4% in the third quarter, with AI investment among its drivers, although the official statistics office does not publish a separate figure for that effect. If that investment slows, the first sectors affected would be construction, equipment and energy. That is our reading, not a data point. |
| Loans and mortgages | Moderate | The fall does not make credit cheaper on its own. The 10-year US bond yield fell only from 4.90% to 4.86% between Wednesday and Friday, and the 30-year mortgage averaged 7.18% (Freddie Mac, 5 November). After the jobs data, the market assigned between 75% and 79% to a Fed hike in December, depending on the time and the source citing CME FedWatch. For the riskiest companies, the extra cost of borrowing rose from 3.32 to 3.48 percentage points between Wednesday and Thursday. |
| Currencies | Moderate, uneven | Between 4 and 6 November the euro lost 0.9% against the dollar, the pound 0.9%, the Korean won 1.5% and the Brazilian real 0.7%. Not all of them fell: the Indian rupee gained 0.8%. If your currency weakens, the prices of imported goods and the cost of dollar debts go up. |
This analysis explains general mechanisms. It is not financial advice or a recommendation to buy, sell or hold any investment. Every situation is different.
What it means in your region
On the site, this section will open automatically to the region you are reading from. You can view the others.
Three precedents
2000-2002, the dot-com bubble. The Nasdaq reached 5,048.62 points on 10 March 2000 and hit 1,114.11 on 9 October 2002: 78% lower. It took until 23 April 2015 to surpass that peak. August 2024. The Nikkei plunged 12.4% in one day and by 13 August had already recovered its previous level. April 2025. US tariffs cost the Nasdaq 6% and 5.8% on two consecutive days, and by 1 May it was back above its previous level.
The lesson: the size of the blow does not tell you how long it will last. Very sharp falls ended in days, in weeks or in fifteen years. In 2000, prices stood far above what companies were earning; in 2024 and 2025, the blow came from a scare that soon faded. Which of these this episode resembles is precisely what is not yet known.
What each actor wants
| Actor | What it wants | What it risks |
|---|---|---|
| Big tech companies | To keep building data centers ahead of their rivals. | Spending more than AI ends up returning. |
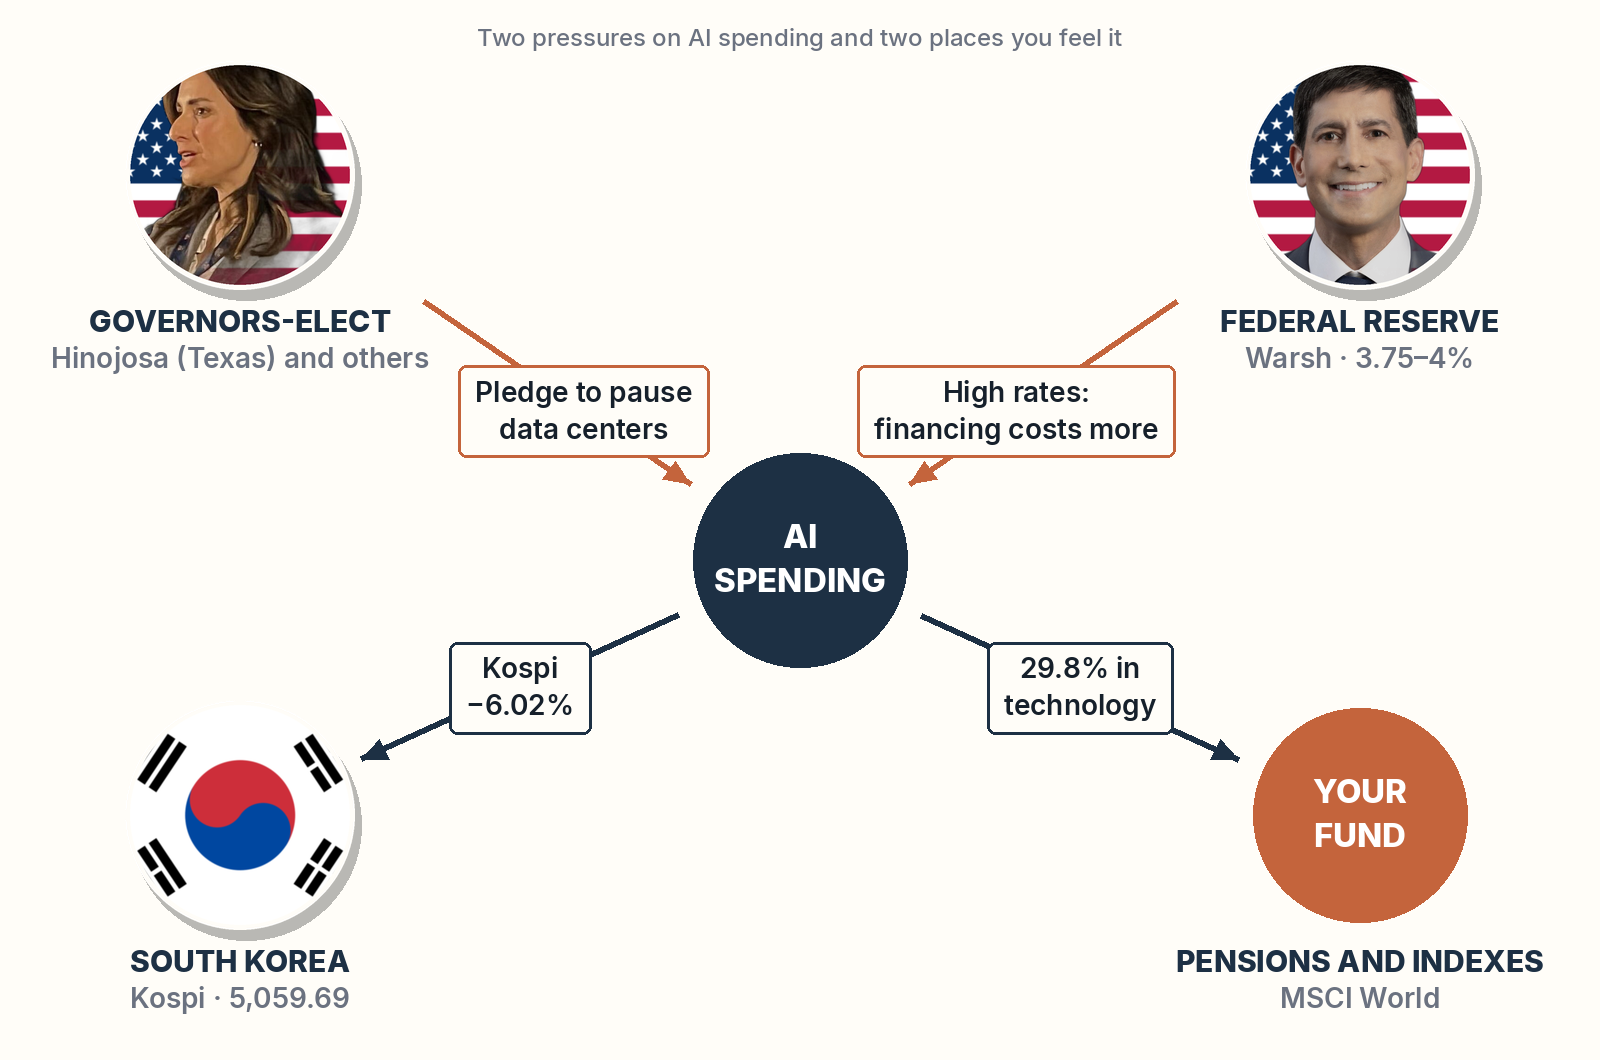
| Governors-elect | To halt data centers or set conditions on them because of the cost of electricity, water and local impact. | Losing investment and jobs; in several states they need legislatures they do not control. |
| Democratic Congress | To place more rules on AI. | A federal law would face a possible veto from President Trump. |
| The Fed (Warsh) | To bring down inflation, even if that makes financing data centers more expensive. | Adding pressure to an already nervous market. |
| South Korea and Taiwan | To avoid forced selling and calm investors. | That the measures fall short if the outflow of foreign capital continues. |
| Pension and index funds | To follow their index or mandate. | Ending up concentrated in a few companies if that is how the market is arranged. |
Two readings of the fall
Our reading. Both readings share one point: in other sell-offs, central banks stepped in to cut rates. Today they are doing the opposite. The Fed raised rates in September, the Bank of Korea in July and August, and the Bank of England this very week, because inflation remains high. If the fall deepens, that help would take longer to arrive. This is analysis, not a proven fact.
Our forecasts
AI panel · 6 November 2026: Claude 62% · GPT-5.6 Sol 62% · Kimi 65% · average 63% Reasons
- Claude (Anthropic), 62%: Needs a 2.75% gain in about 16 sessions; elevated volatility and a likely Fed hike offset rebound tendencies and positive drift.
- GPT-5.6 Sol (OpenAI), 62%: The index needs a meaningful rebound above 7,580, but elevated rates and fragile tech sentiment make a full November recovery less likely than not.
- Kimi (Moonshot AI), 65%: Needs a 2.75% rise in 15 sessions to stay above; sharp drops often rebound but high rates and fragile sentiment keep the odds near two-thirds.
AI panel · 6 November 2026: Claude 63% · GPT-5.6 Sol 72% · Kimi 60% · average 65% Reasons
- Claude (Anthropic), 63%: Only 1.2% above the threshold with extreme volatility over 29 sessions, though Wall Street's rebound and Korean support measures may lift it initially.
- GPT-5.6 Sol (OpenAI), 72%: Kospi sits only about 1.2% above 5,000 after extreme volatility, making at least one sub-5,000 close quite plausible despite stabilization measures.
- Kimi (Moonshot AI), 60%: Just 1.2% above 5,000 after two days falling over 5%, but Korean stabilization measures and the Wall Street rebound cap the probability.
AI panel · 6 November 2026: Claude 84% · GPT-5.6 Sol 80% · Kimi 85% · average 83% Reasons
- Claude (Anthropic), 84%: A 12.3% gain to a new record close in 37 sessions is rare, though high volatility and sharp rebounds keep it possible.
- GPT-5.6 Sol (OpenAI), 80%: Nasdaq needs roughly a 12% rally to reclaim its record within seven weeks, while high rates and shaken AI valuations remain substantial headwinds.
- Kimi (Moonshot AI), 85%: Must rise 12.3% in 37 sessions, a move seen in only about 10-15% of comparable periods, with central banks still hiking.
What to watch
- 10 November: US inflation for October.
- 17 November: results from Nvidia, the largest maker of AI chips. They matter as a signal of how much its customers are still spending.
- 25 November: second estimate of US third-quarter growth.
- 26 November: Bank of Korea decision.
- 4 December: US jobs data for November.
- 8 and 9 December: the Fed's last meeting of the year.
- 17 December: decisions by the European Central Bank and the Bank of England.
- January: the new governors take office. That is when it will become clear whether the pause promises turn into decrees.
Timeline
- The Nasdaq and the S&P 500 set their record closes.
- US midterm elections: Democrats win control of Congress.
- The Dow rises 3% and the S&P 500 1.6%.
- The Nasdaq falls 5.5%, its worst day since April 2025. The Bank of England raises its rate to 4%.
- Trading is halted in Seoul. Tokyo falls 5.96%. Wall Street rebounds after the jobs data.
- Publication of the analysis with three open forecasts.
One forecast resolved so far, and it was correct (European summit, analysis of 14 October). The tally is updated as each forecast comes due.
Sources and method32 sources · facts separated from analysis
Official data: Federal Reserve Bank of St. Louis, FRED (Nasdaq, S&P 500, Dow Jones, Nikkei, Cboe VIX and ICE BofA high-yield bond spread), US Department of the Treasury (yield curve), US Bureau of Labor Statistics (October employment and CPI calendar), US Bureau of Economic Analysis (GDP), Federal Reserve (2025 Survey of Consumer Finances), Freddie Mac, Bank of England (5 November decision), European Central Bank (rates, exchange rates and calendar), Central Bank of Chile (official observed dollar rate), MSCI (World and ACWI index fact sheets, 30 October), State Street (holdings of its S&P 500 fund, 5 November) and Nvidia (earnings calendar).
Press: Associated Press (5 and 6 November), Deutsche Welle and The Guardian (6 November), The Korea Herald, Seoul Economic Daily and Yonhap (Kospi), SBS (Nikkei), Focus Taiwan and Taiwan News (Taiex and stabilization fund), investingLive (European closes), Yahoo Finance (semiconductors), CNN (value lost), Fortune, The Texas Tribune and Cleanview (data centers), Emol (AFP), CNBC and MPA (employment and FedWatch), Al Jazeera (elections), The Kyunghyang Shinmun (Bank of Korea).
Exchange rates: 4 and 6 November are compared using ECB reference rates and the Central Bank of Chile's official observed dollar rate.
What we could not confirm: the Kospi's fall of more than 8% was intraday; the close was down 6.02%. We do not include stock market closes for Brazil, Mexico, Chile, India, South Africa or the Gulf because we could not verify them in two sources. The Kospi's June peak comes from a single source.
Method: each forecast has a date and an objective verification rule. The probabilities are our estimate, not a certainty; the historical calculations use FRED series. If a forecast cannot be clearly resolved, we report it as unresolvable. This analysis is not financial advice.
More stories

European Commission issues preliminary findings against TikTok algorithm; company rejects them
The Commission says TikTok's recommendation algorithm creates a harmful "rabbit hole" effect under the EU's Digital Services Act, while TikTok calls its statements "fundamentally inaccurate" and can respond before a final decision.
Candidates from Spain and the Netherlands in contest to succeed Lagarde at ECB
Candidates from Spain and the Netherlands are in the contest to lead the European Central Bank, and the WSJ names them as Pablo Hernandez de Cos and Klaas Knot.

Paraguay's Peña impeached and removed in banking affair; Alliana sworn in as president
Santiago Peña has been impeached and removed as Paraguay's president in connection with a banking affair, and former Vice President Pedro Alliana has been sworn in to replace him.
Comments